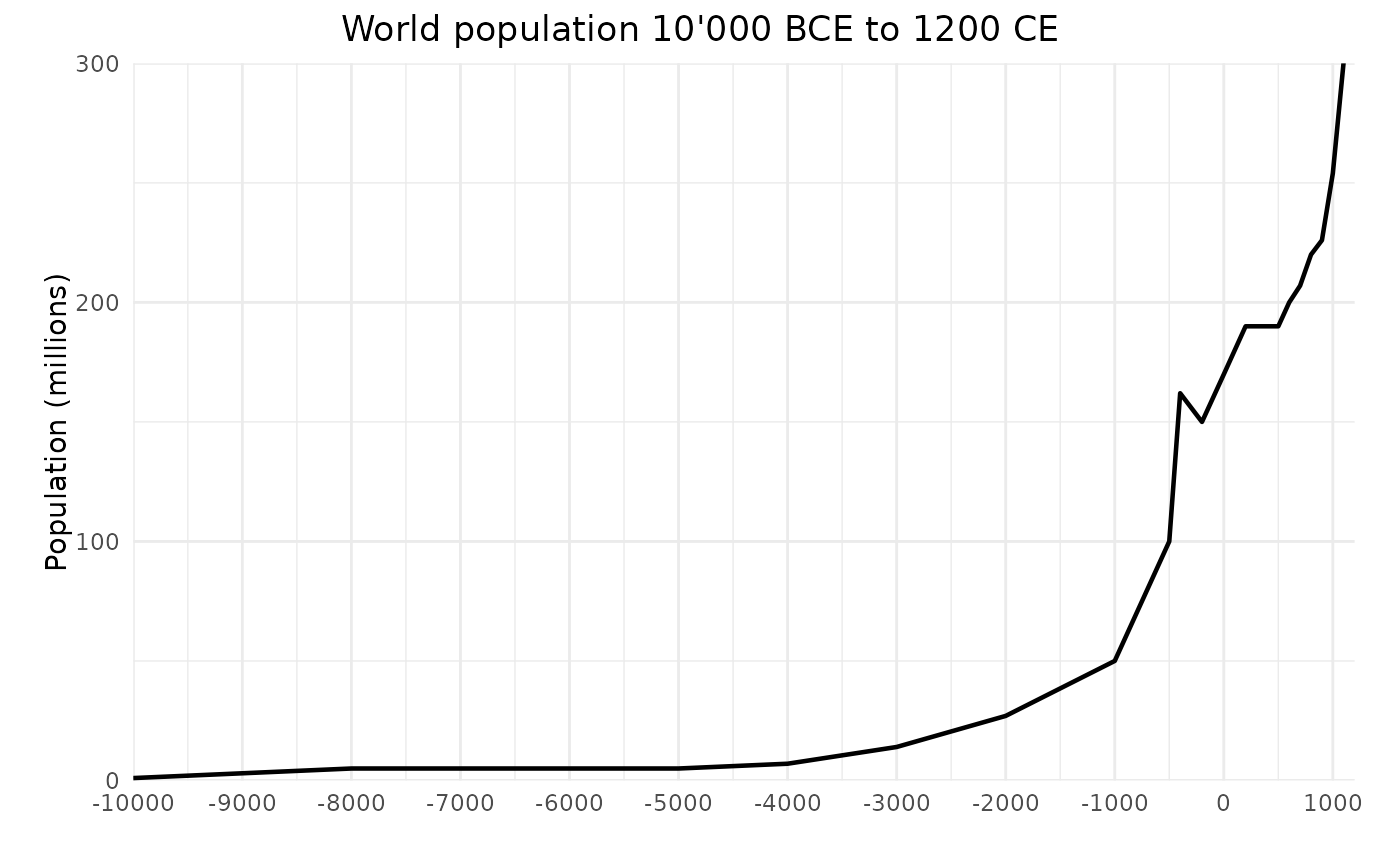
Historical world population plot
Source:R/plot_df_demography.R
df_demography_graph_world_population_historical.RdWorld population graph from 10'000 BCE to 1200 CE
Usage
df_demography_graph_world_population_historical(
  theme = ggplot2::theme_minimal()
)