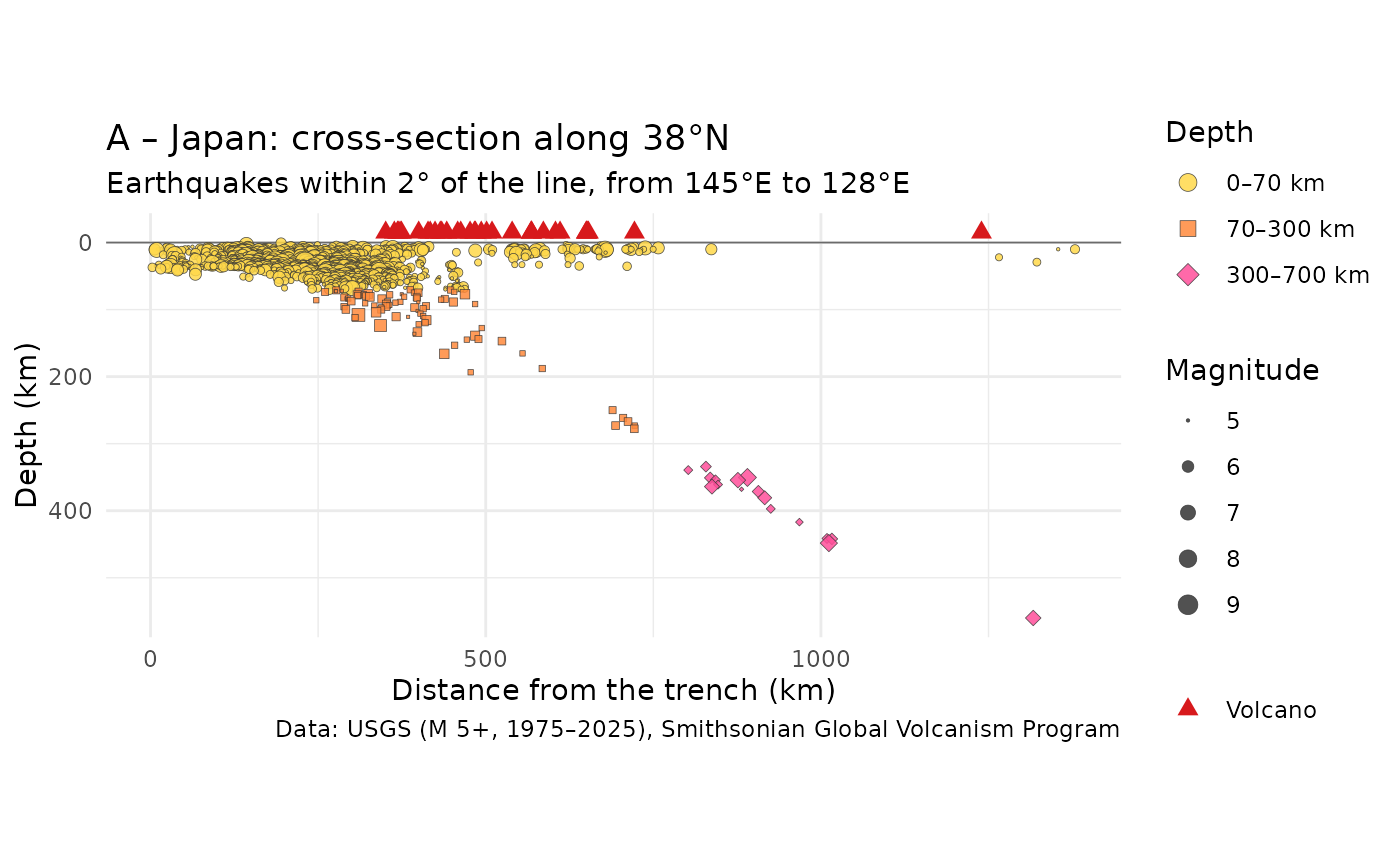
Depth of the earthquakes against their distance from the trench, along a
line across a subduction zone (answer key of the plate detective exercise).
Earthquakes within half_width degrees of latitude of the line are kept;
volcanoes near the line are shown at the surface.
Usage
df_geology_graph_cross_section(
  region = c("A", "B"),
  half_width = 2,
  lat = NULL,
  from = NULL,
  to = NULL,
  title = TRUE,
  theme = ggplot2::theme_minimal()
)

df_geology_hc_cross_section(
  region = c("A", "B"),
  half_width = 2,
  lat = NULL,
  from = NULL,
  to = NULL,
  title = TRUE
)
Arguments
- region
"A"(Japan, along 38° N from 145° E to 128° E) or"B"(Central Andes, along 22° S from 72° W to 62° W)- half_width
Half width of the band around the line, in degrees of latitude
- lat, from, to
Latitude of the line and longitudes of its start (the trench side) and end, in degrees (west and south negative).
NULLuses the default line of the region.- title
TRUEfor a title with the region and the line,FALSEfor no title, or a string- theme
A ggplot2 theme