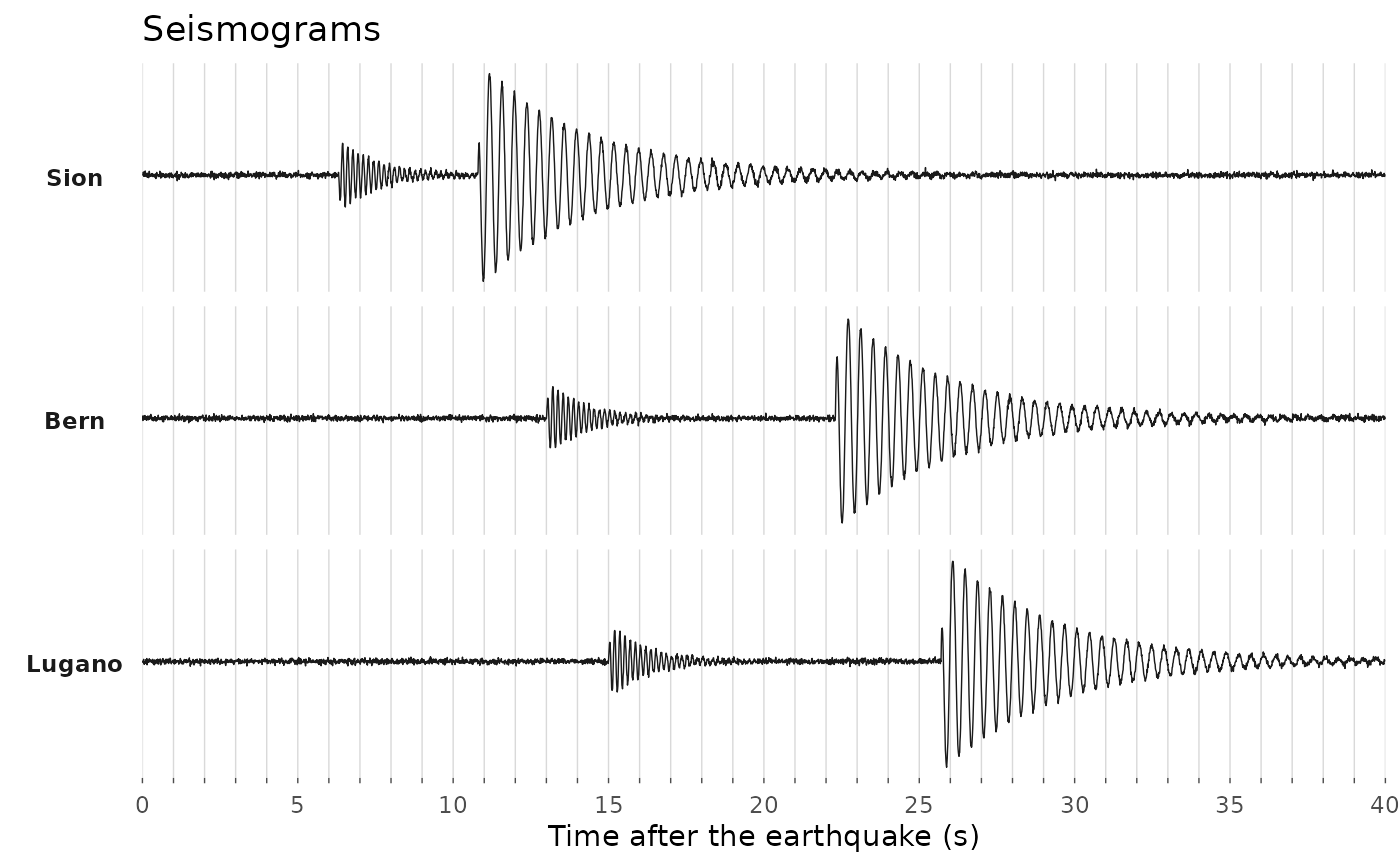
Synthetic seismograms of the same earthquake at the three stations of the epicentre exercise, stacked on the same time axis (seconds after the earthquake, a tick every second): first the small P wave, then the larger S wave. The key version marks the arrivals of the P and S waves.
Usage
df_geology_graph_seismograms(
  key = FALSE,
  title = TRUE,
  theme = ggplot2::theme_minimal()
)

df_geology_hc_seismograms(key = FALSE, title = TRUE)