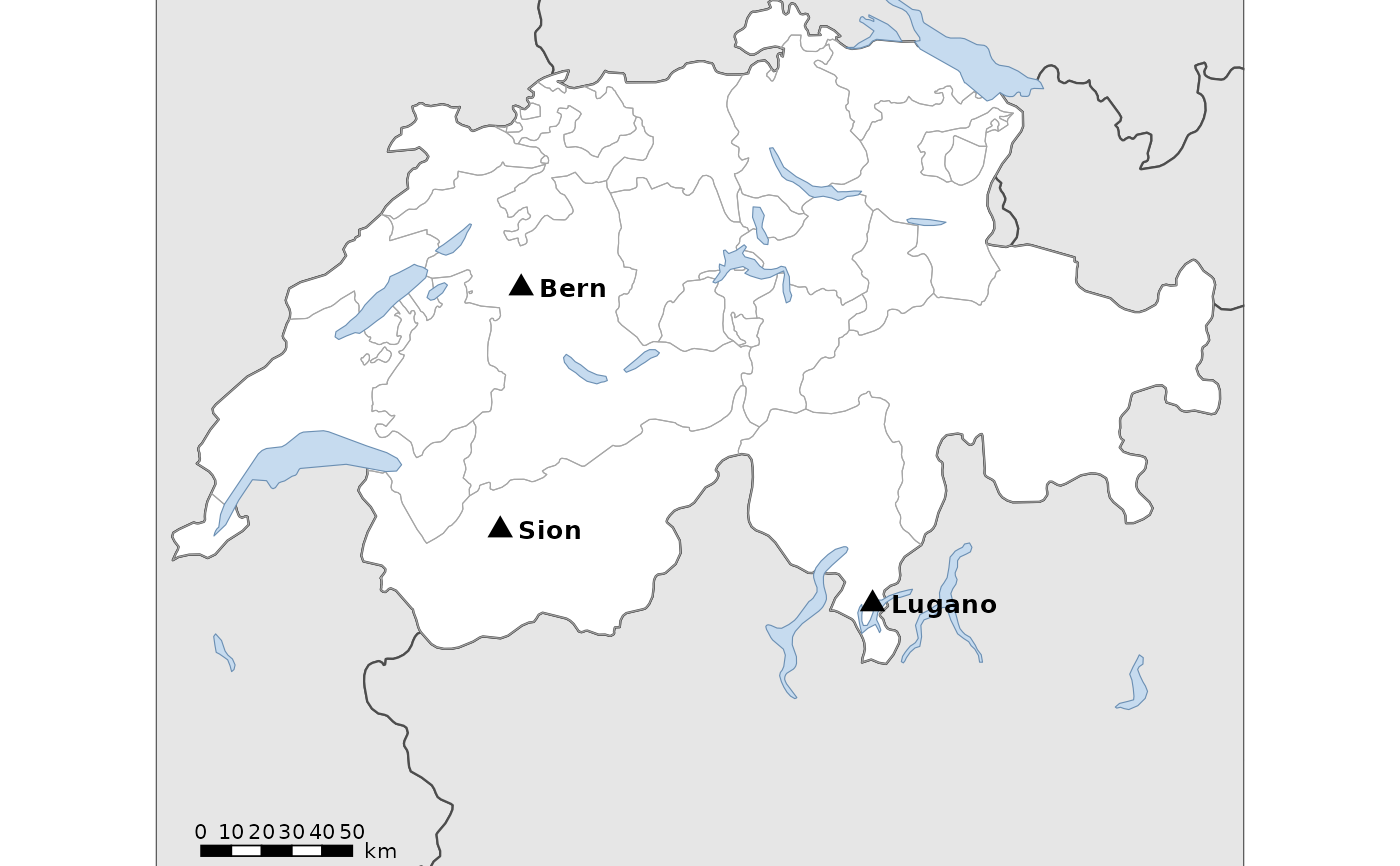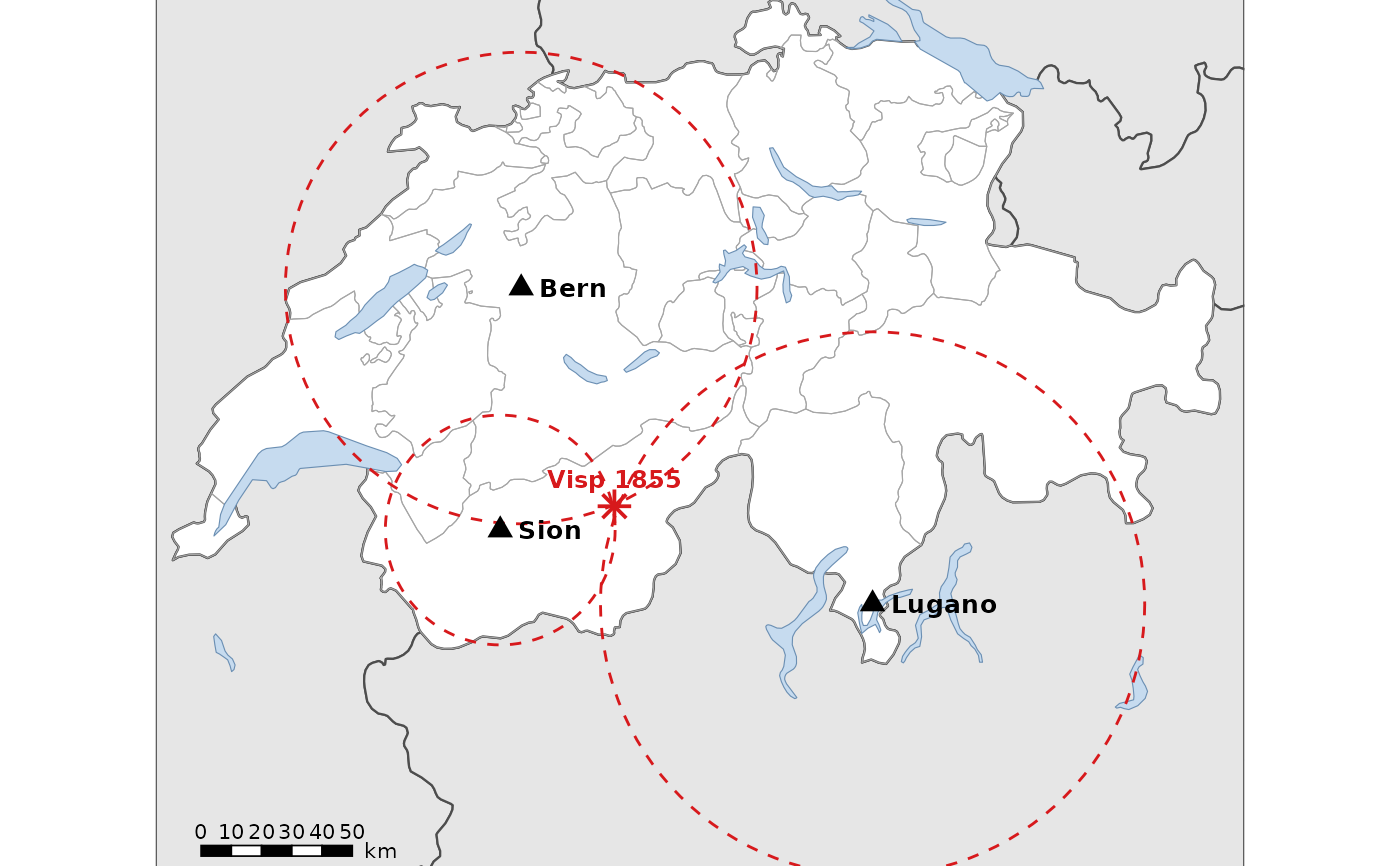
Find the earthquake: map of the stations
Source:R/map_df_geology_hazards.R
df_geology_map_epicentre.RdMap of Switzerland with the three seismic stations of the epicentre exercise
(Sion, Bern and Lugano), for drawing circles with a compass. The map is in
the Swiss projection LV95, so distances are true, and its panel has a fixed
size: printed at 100 %, the map has the scale 1:scale. The key version adds
the circles (radius: distance to the epicentre) and the epicentre of the
Visp earthquake of 1855.
Usage
df_geology_map_epicentre(
  key = FALSE,
  scale = 2500000,
  title = TRUE,
  theme = ggplot2::theme_minimal()
)

df_geology_map_leaflet_epicentre(key = FALSE)Value
A ggplot2 map (df_geology_map_epicentre()) or a leaflet map
(df_geology_map_leaflet_epicentre())