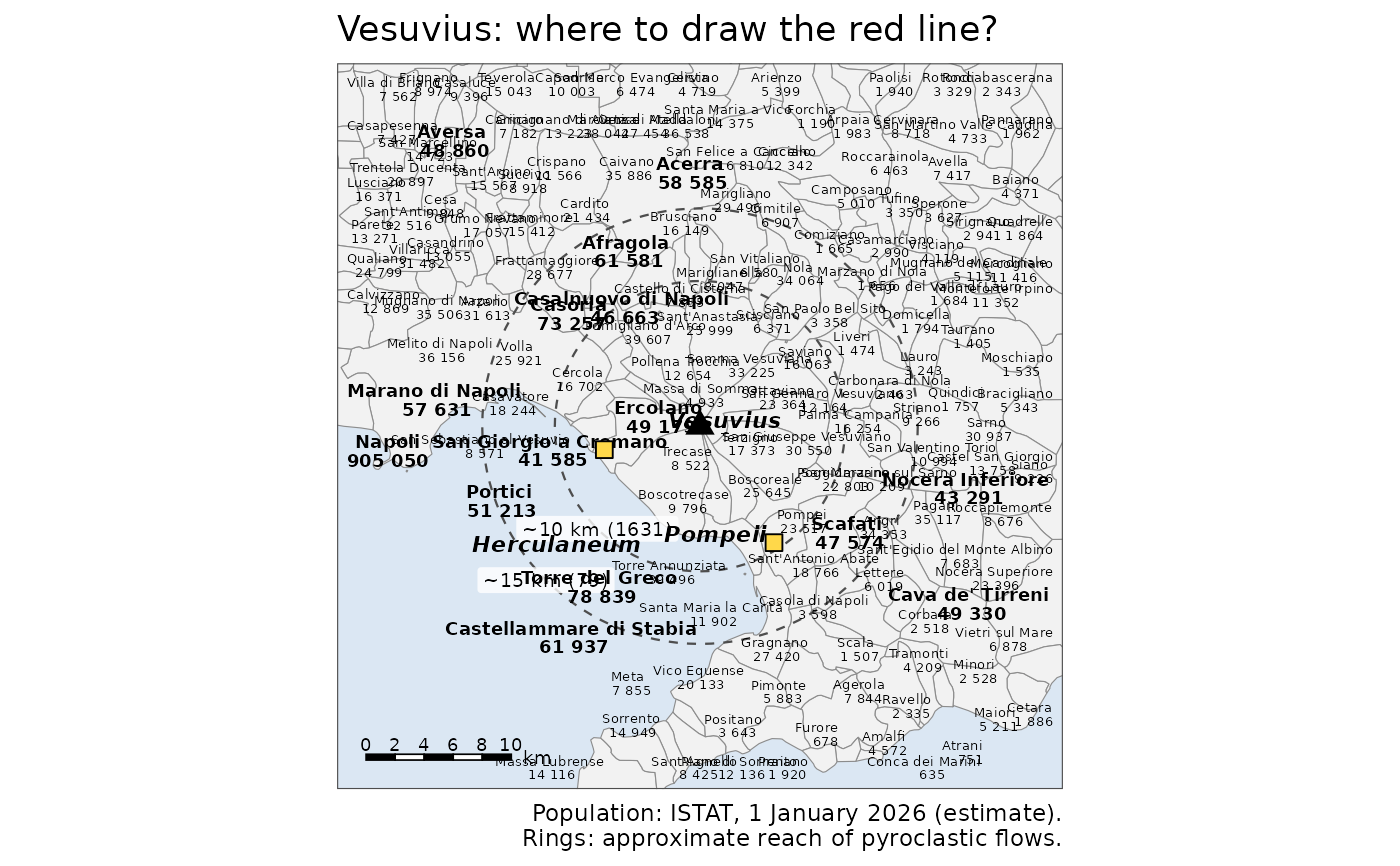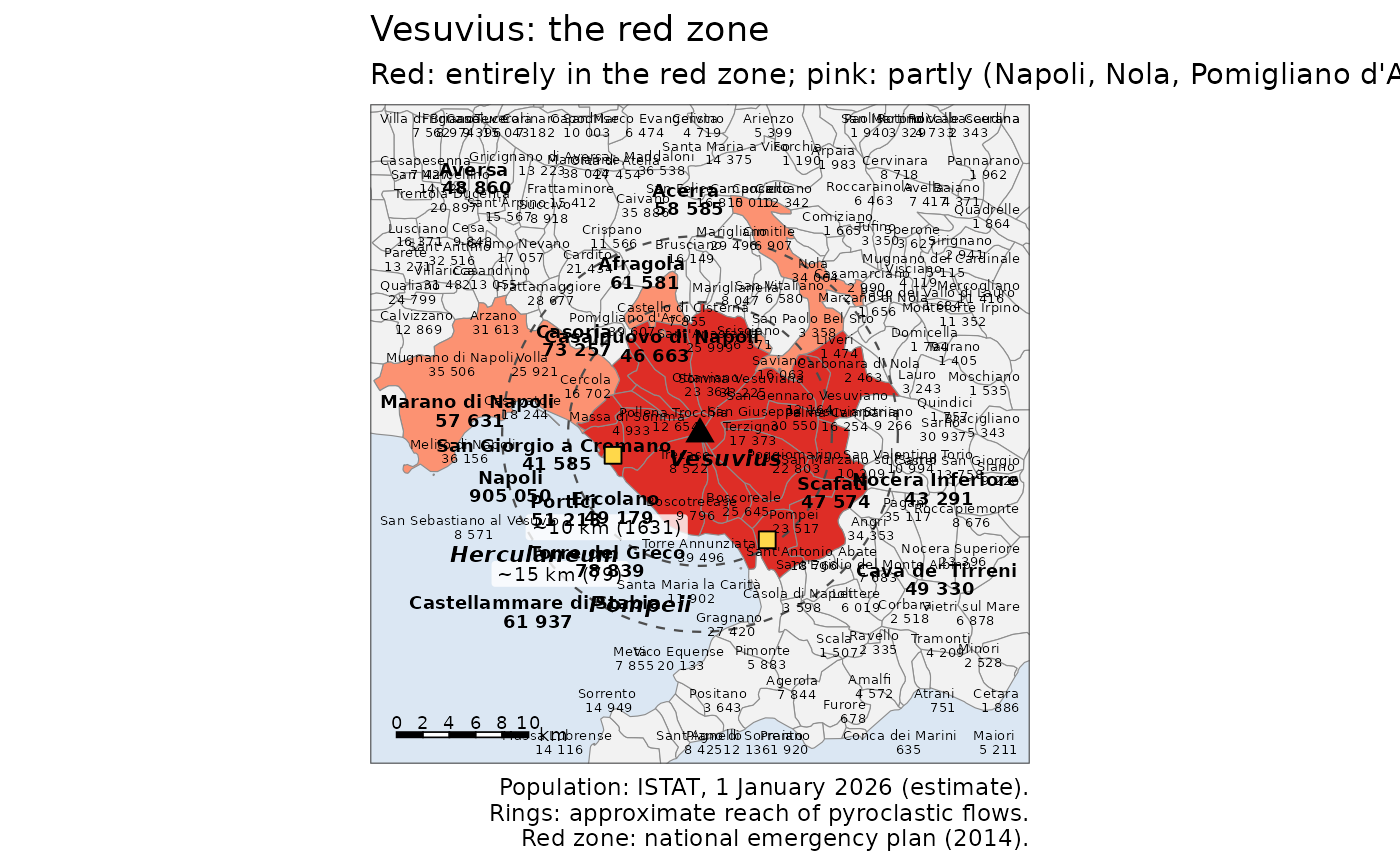
Map of the municipalities around Vesuvius with their names and population, the crater, the ancient sites of Pompeii and Herculaneum and rings showing the approximate reach of the pyroclastic flows of past eruptions. The key version colours the red zone of the national emergency plan (municipalities entirely or partly in it).
Usage
df_geology_map_vesuvius(
  key = FALSE,
  rings = c(`1631` = 10, `79` = 15),
  half_width = 25,
  title = TRUE,
  theme = ggplot2::theme_minimal()
)

df_geology_map_leaflet_vesuvius(key = FALSE, rings = c(`1631` = 10, `79` = 15))
Arguments
- key
TRUEto colour the official red zone- rings
Named vector of ring radii in km around the crater; the names label the rings (approximate reach of pyroclastic flows)
- half_width
Half width of the map around the crater in km (ggplot version)
- title
TRUEfor a default title,FALSEfor none, or a string- theme
A ggplot2 theme