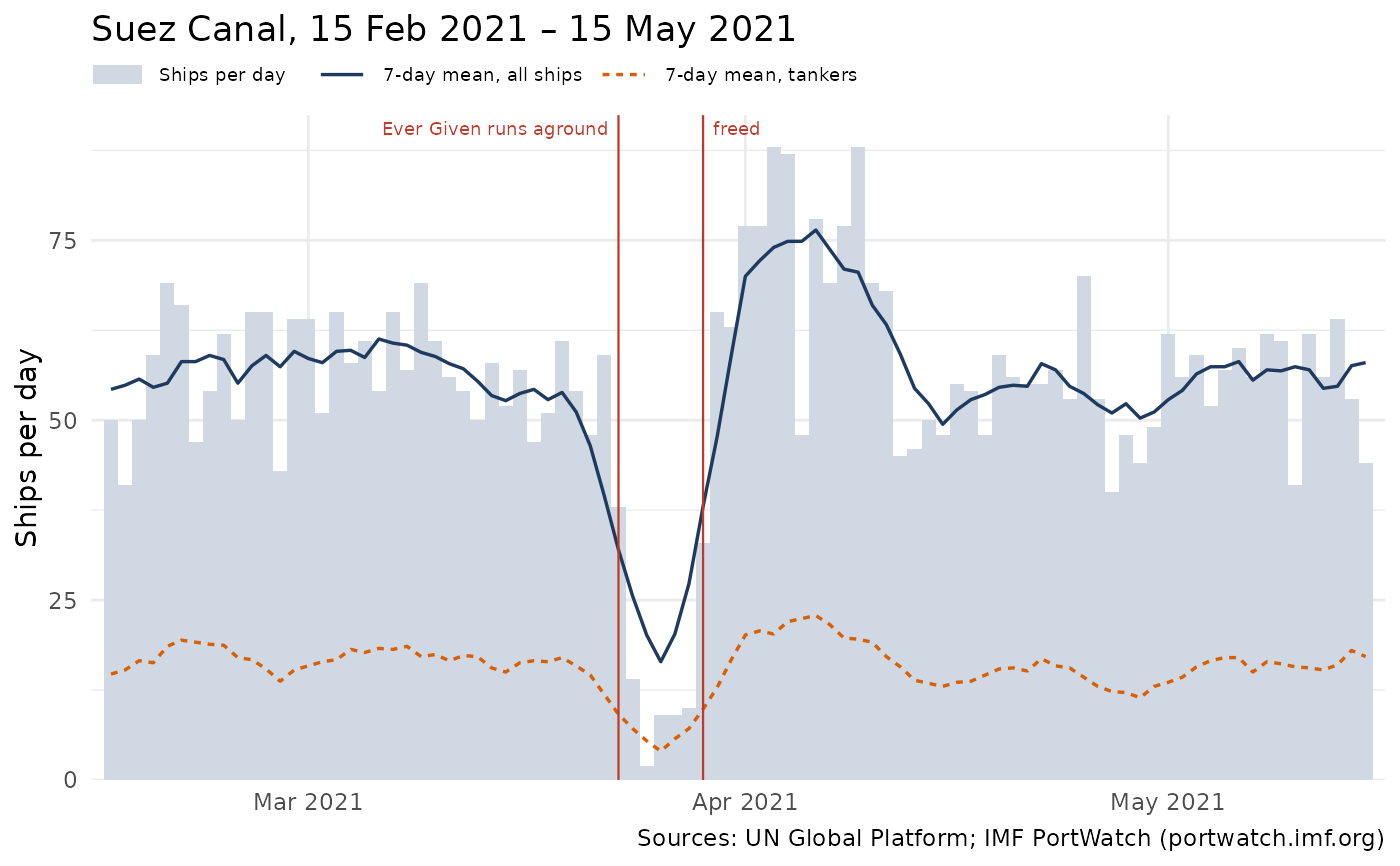
Daily number of ships passing a maritime chokepoint (IMF PortWatch, AIS
estimates) over a period: daily total, 7-day centred mean of all ships and
7-day centred mean of tankers. The student version shows only label as
title; the key version (key = TRUE) shows the name of the chokepoint and
the period, and marks the events. Texts are in English or French,
following geotools::gtl_opt_set_i18n() (label and events are passed
as they are).
Usage
df_geopolitics_graph_chokepoint(
  chokepoint,
  from = NULL,
  to = NULL,
  key = FALSE,
  label = NULL,
  events = NULL,
  theme = ggplot2::theme_minimal()
)

df_geopolitics_hc_chokepoint(
  chokepoint,
  from = NULL,
  to = NULL,
  key = FALSE,
  label = NULL,
  events = NULL,
  daily_color = "#cfd8e3",
  total_color = "#1f3a5f",
  tanker_color = "#d95f02"
)
Arguments
- chokepoint
PortWatch identifier, e.g.
"chokepoint1"(Suez Canal), see geodata::df_geopolitics_chokepoints_daily- from, to
First and last day (dates or
"YYYY-MM-DD");NULLfor the first or the latest day available- key
TRUEfor the answer key: real name, period and events- label
Title of the student version (e.g.
"Chokepoint A"),NULLfor none- events
A data frame with columns
dateandlabel(short), shown as vertical lines in the key version- theme
A ggplot2 theme
- daily_color, total_color, tanker_color
Colours of the daily bars and of the 7-day means of all ships and of tankers (highcharts version, e.g. for a dark theme)
Value
A ggplot2 graph (df_geopolitics_graph_chokepoint()) or a
highcharts chart (df_geopolitics_hc_chokepoint(), to be themed with
e.g. ggeo::hc_web_theme())