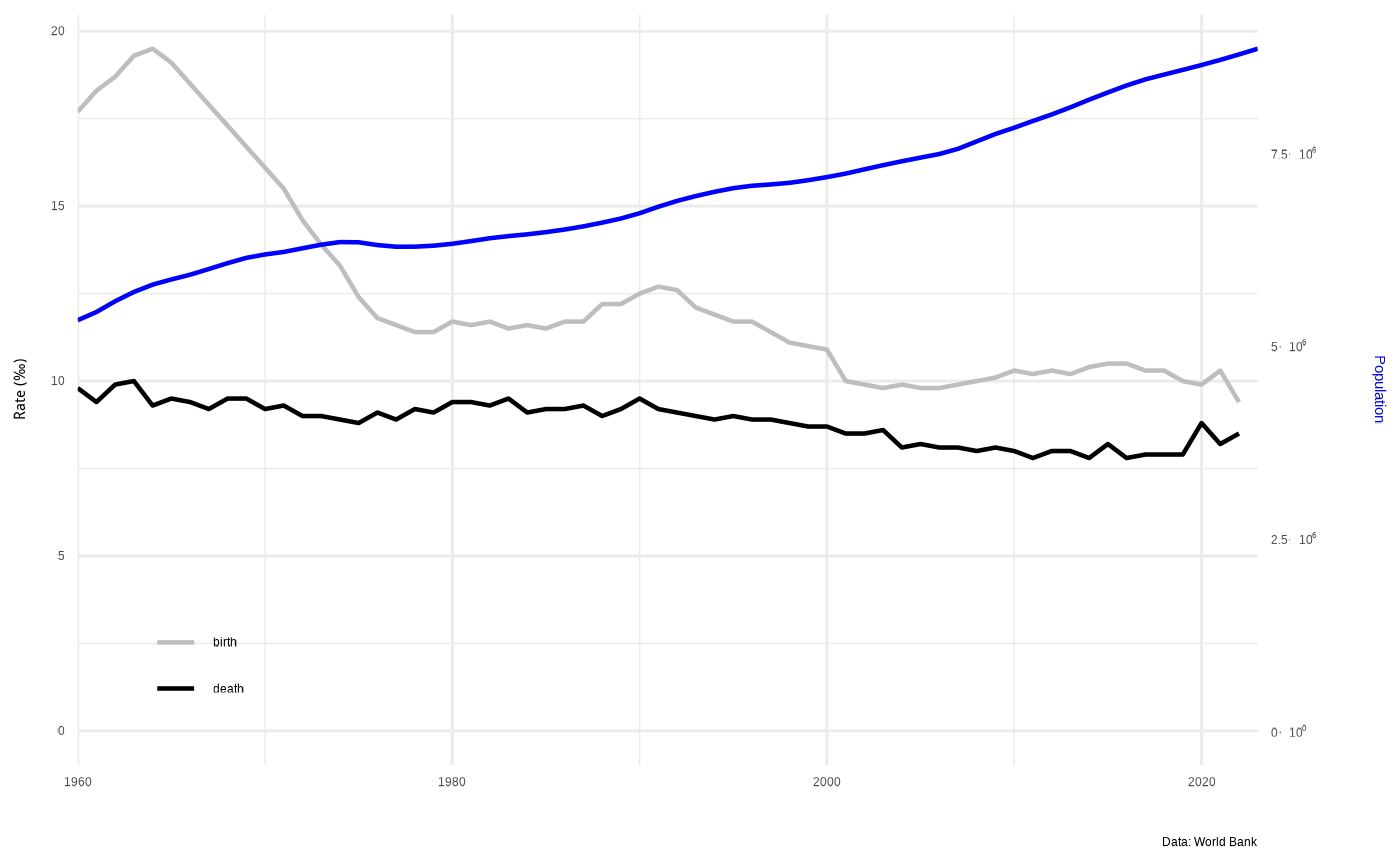
Provides basic ggplot2 graph with the following data on it :
- population
the population curve (blue)
- birth_rate
the birth rate curve (grey)
- death_rate
the death_rate curve (black)
Usage
gph_demogram(
  country,
  theme = ggplot2::theme_minimal(),
  population_color = "blue"
)
Arguments
- country
A string with the country name
- theme
A ggplot2 theme
- population_color
A color value for the population curve
Examples
gph_demogram("Switzerland")
#> Warning: Removed 1 row containing missing values or values outside the scale range
#> (`geom_line()`).
#> Warning: Removed 1 row containing missing values or values outside the scale range
#> (`geom_line()`).


