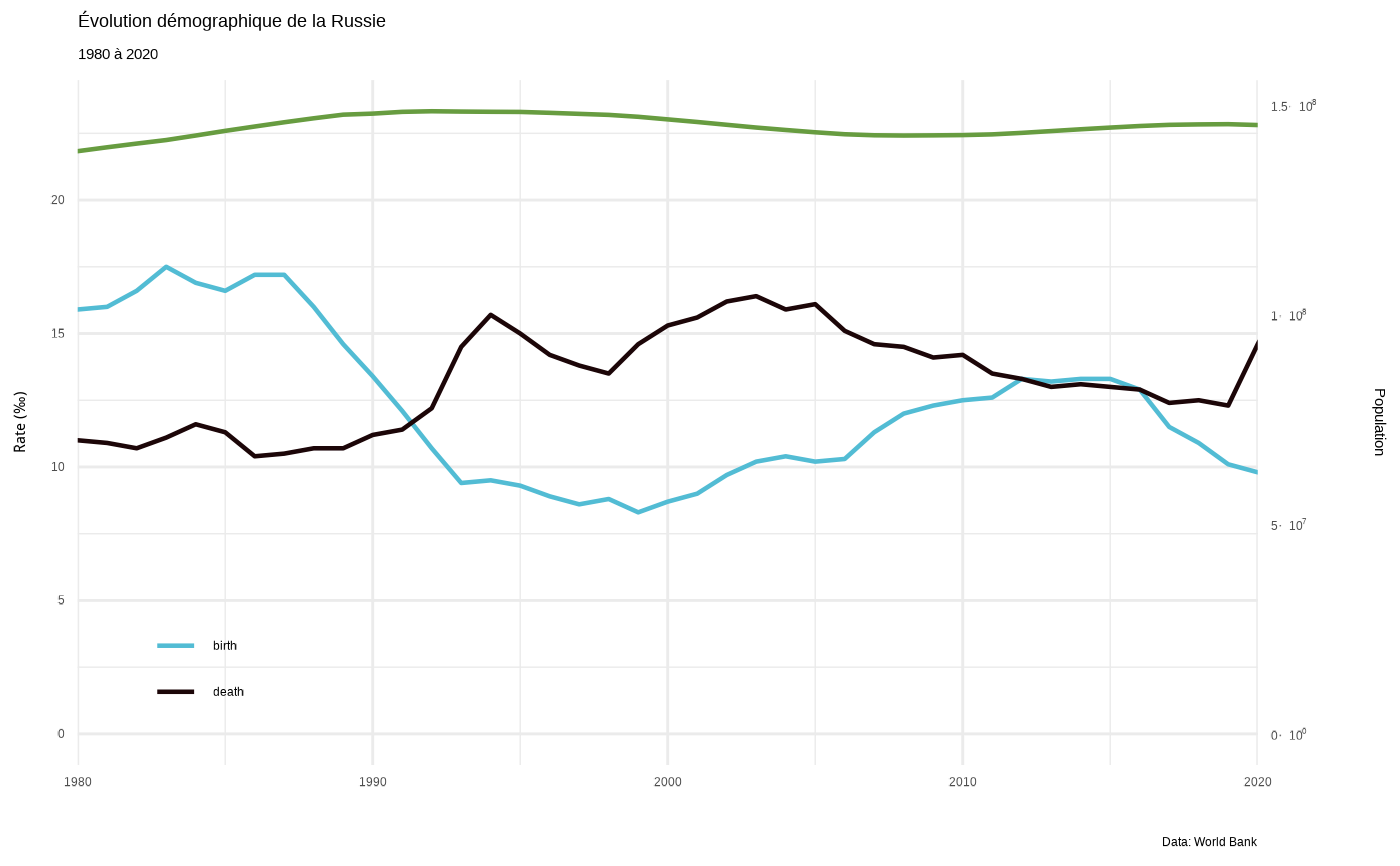
Graphique de l'évolution démographique de la Russie entre 1980 et 2020. Graphique destiné à l'examen de maturité2022.
Usage
oc_russie_graph_demo_exa(theme = ggplot2::theme_minimal())Examples
oc_russie_graph_demo_exa()
#> Scale for colour is already present.
#> Adding another scale for colour, which will replace the existing scale.
#> Scale for x is already present.
#> Adding another scale for x, which will replace the existing scale.
#> Warning: Removed 1 row containing missing values or values outside the scale range
#> (`geom_line()`).
#> Warning: Removed 1 row containing missing values or values outside the scale range
#> (`geom_line()`).

