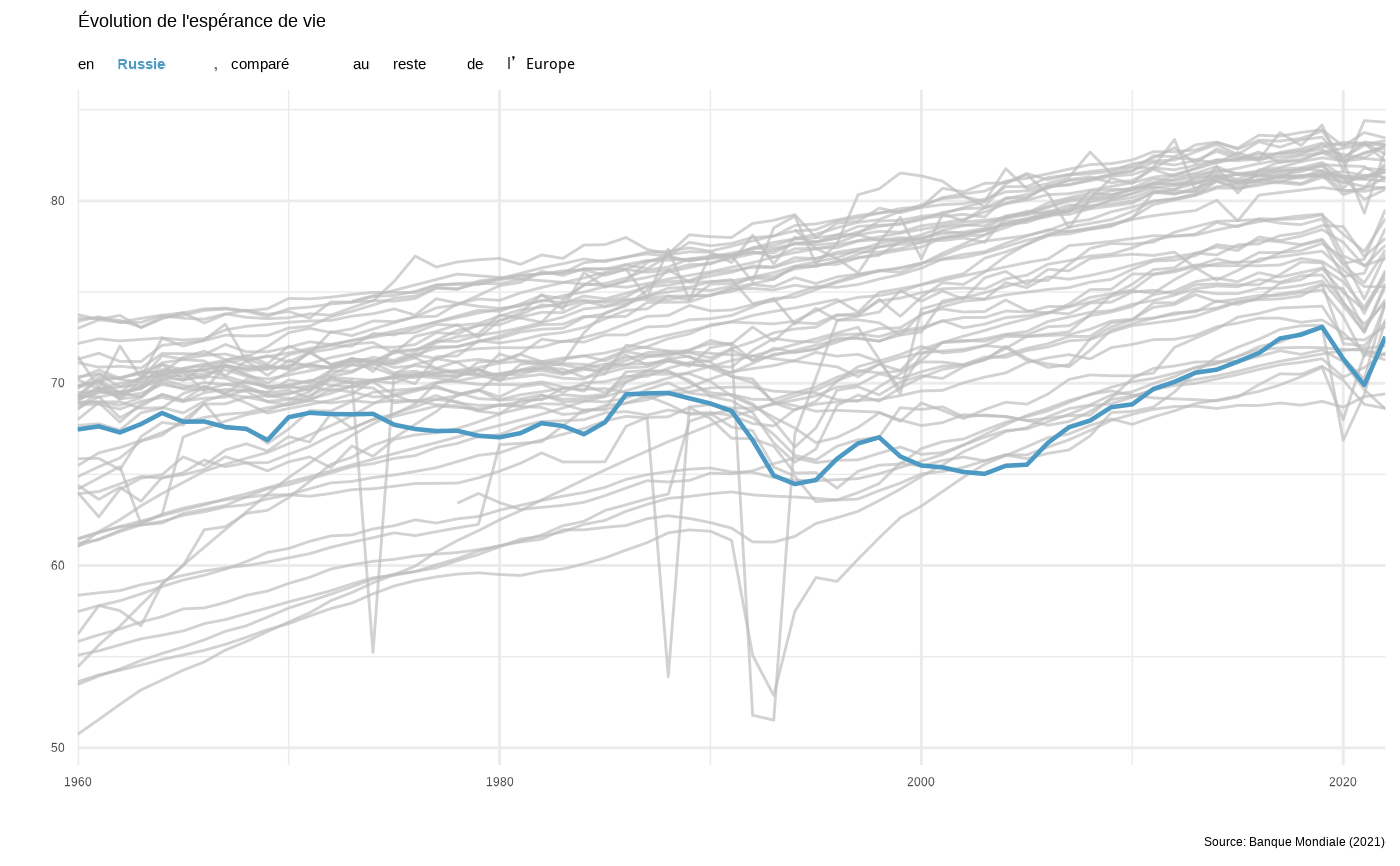
Graphiques qui montrent l'évolution de l'espérance de vie de la Russie.
Usage
oc_russie_graph_esperance_europe(theme = ggplot2::theme_minimal())

oc_russie_hc_esperance_europe()

oc_russie_graph_esperance_65_femmes(theme = ggplot2::theme_minimal())

oc_russie_graph_esperance_65_hommes(theme = ggplot2::theme_minimal())Examples
oc_russie_graph_esperance_europe()
#> Warning: Tried to calculate with group_by(), but the calculation failed.
#> Falling back to ungrouped filter operation...
 oc_russie_hc_esperance_europe()
if (FALSE) {
# Not run: needs credentials for HMD database
oc_russie_graph_esperance_65_femmes()
oc_russie_graph_esperance_65_hommes()
}
