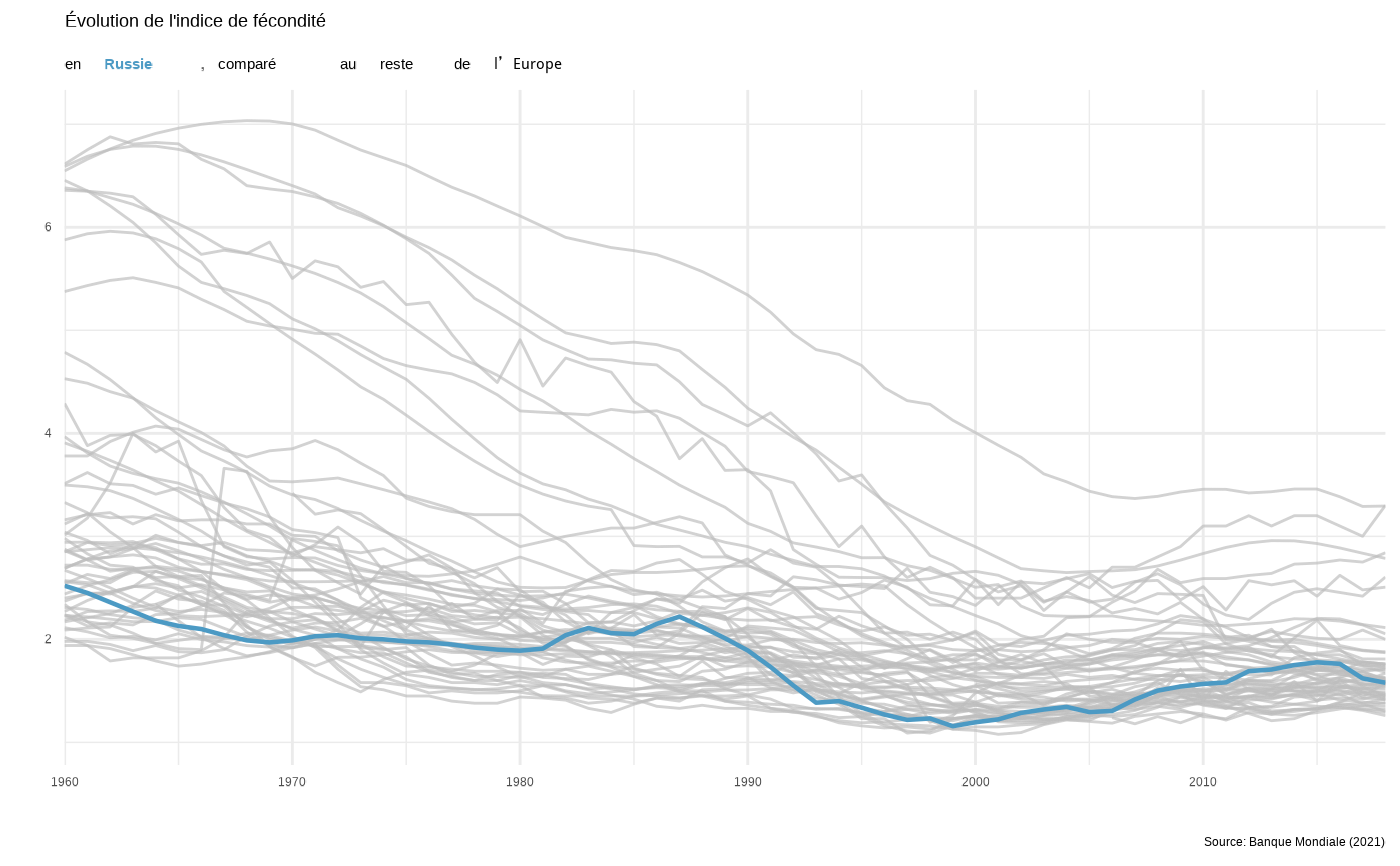
Graphique de l'évolution de l'indice de fécondité de la Russie comparé au reste de l'Europe.
Usage
oc_russie_graph_fertilite_europe(theme = ggplot2::theme_minimal())

oc_russie_hc_fertilite_europe()Examples
oc_russie_graph_fertilite_europe()
#> Warning: Tried to calculate with group_by(), but the calculation failed.
#> Falling back to ungrouped filter operation...
#> Warning: Removed 236 rows containing missing values or values outside the scale range
#> (`geom_line()`).
 oc_russie_hc_fertilite_europe()
