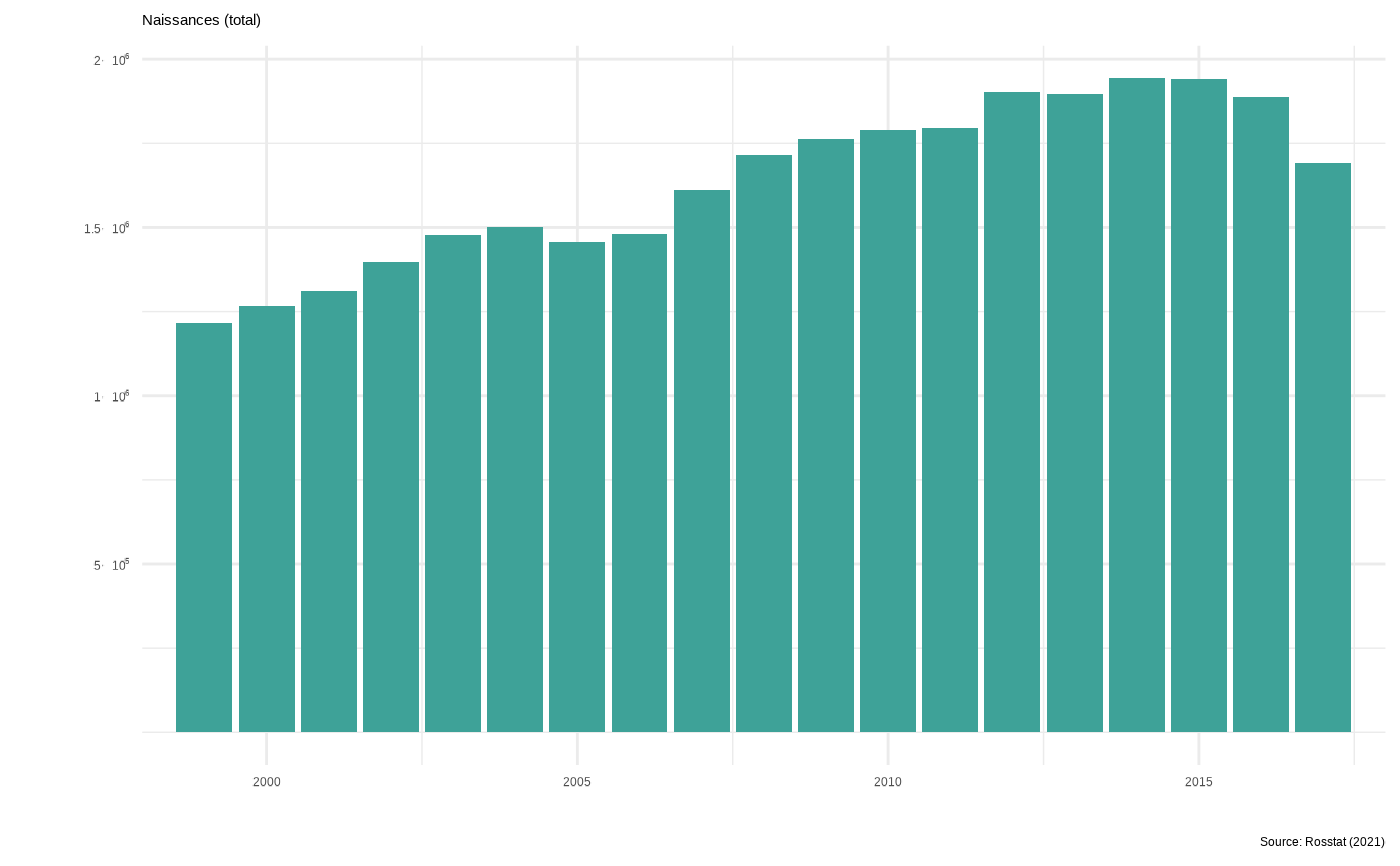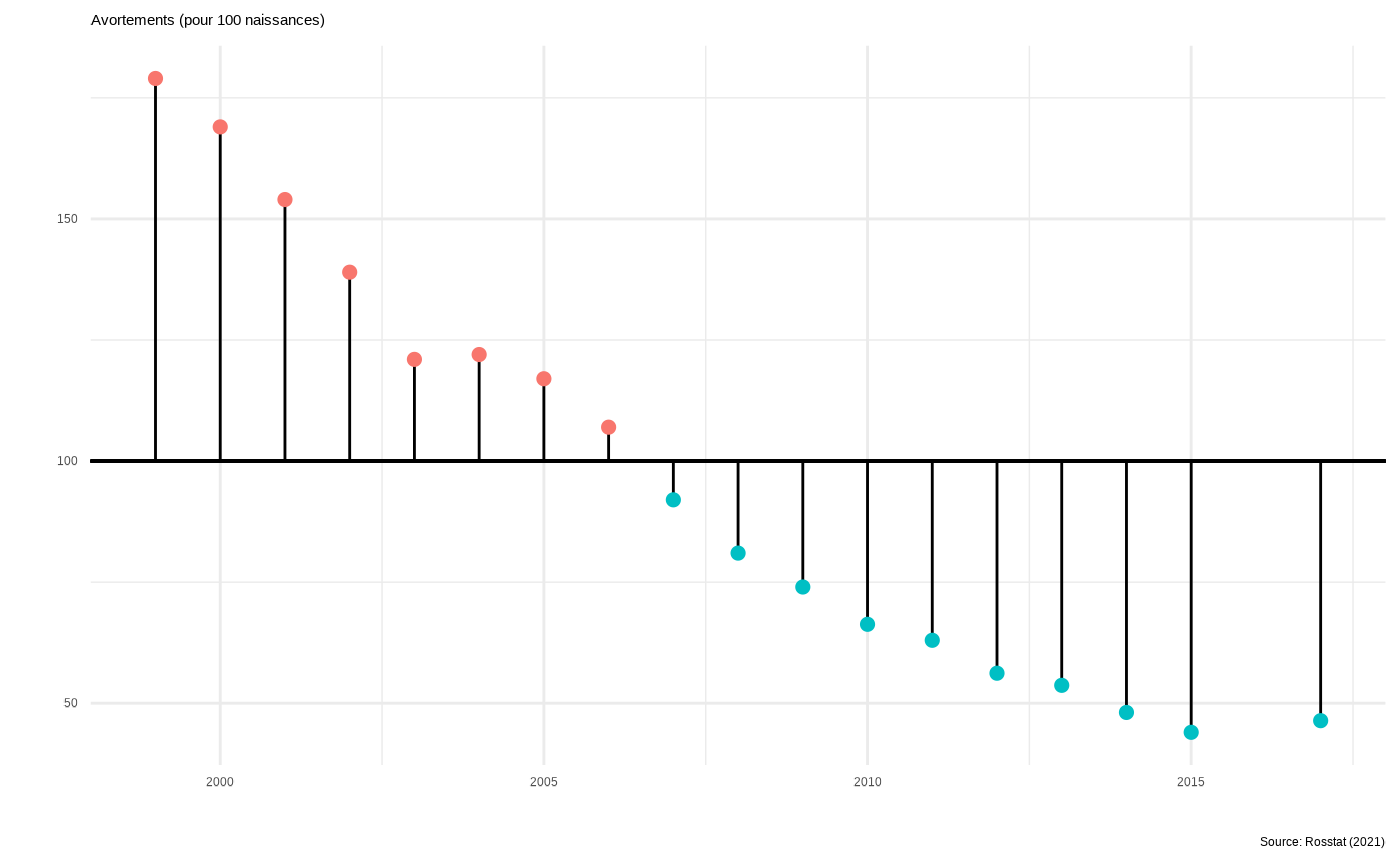
Naissances et avortements en Russie
Source:R/plot_oc_russie.R
oc_russie_graphs_naissances_et_avortement.RdGraphique des naissances et des avortements en Russie jusqu'en 2017.
Usage
oc_russie_graph_naissances(theme = ggplot2::theme_minimal())

oc_russie_graph_avortements(theme = ggplot2::theme_minimal())

oc_russie_graph_naissance_et_avortements(theme = ggplot2::theme_minimal())Examples
oc_russie_graph_naissances()

oc_russie_graph_avortements()
#> Warning: All aesthetics have length 1, but the data has 18 rows.
#> ℹ Please consider using `annotate()` or provide this layer with data containing
#>   a single row.

if (FALSE) { # interactive()
# Not run: needs patchwork to assemble the plot and only
# works if the package is loaded
oc_russie_graph_naissance_et_avortements()
}